KPIs to Prove Brand Equity's Revenue Impact for Brand Managers
11/05/2026
Brand Strategy
Learn how to measure brand equity using five essential KPIs that connect brand perception, customer loyalty, and pricing power to measurable business growth.
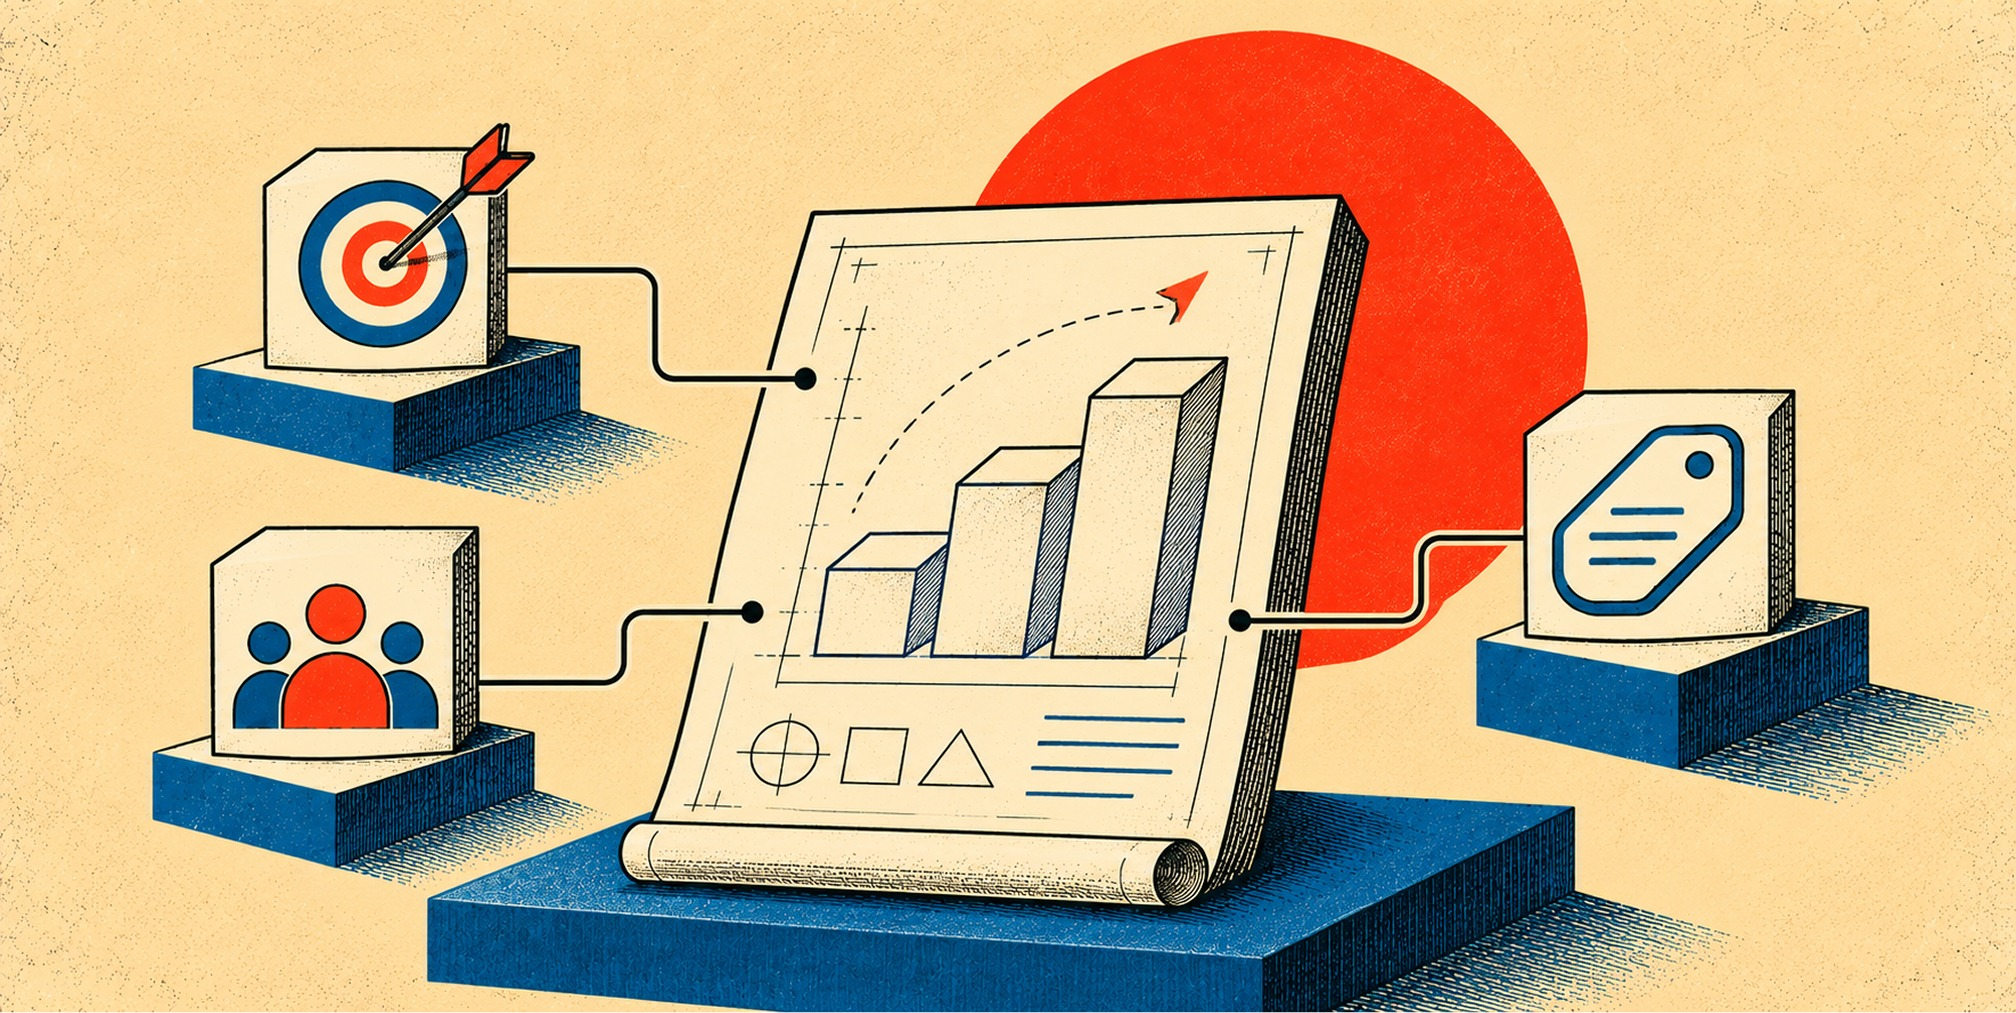
Brand equity measurement means tracking how much a brand’s name, associations, and reputation add to a product’s financial and market performance, beyond what a generic alternative would earn. The strongest approach never relies on one lens alone: combine customer-based metrics (awareness, associations, loyalty), product-market outcomes (price premium, market share), and financial valuation. Anchor the system with ISO 20671 governance and revenue-premium tracking, since that combination connects perception to dollars leadership actually cares about.


What Is Brand Equity? Customer, Firm, and Financial Framing



Brand equity means different things depending on which discipline is answering the question, and mixing up the frames is where most tracking programs go wrong.
The customer-based view, built on Kevin Keller’s foundational work at Stanford, defines brand equity as the differential effect that brand knowledge has on how consumers respond to marketing. Two components drive it: awareness (does the customer know you exist and what you do) and associations (the mental shortcuts, quality perceptions, and feelings tied to your name). This is the lens most brand trackers and surveys measure.
The firm or product-market perspective steps back from the customer’s head and into the market itself. It asks what your brand actually does for revenue: can you charge more than an unbranded competitor, do you hold more shelf space, does your market share hold up when a rival cuts prices? This view treats brand equity as observable behavior, not stated opinion.
Financial and valuation approaches, the kind used in M&A due diligence or balance-sheet reporting, translate all of the above into a dollar figure, often for accounting or licensing purposes. Use this framing when the audience is finance, not marketing. For day-to-day brand management, the customer and product-market views matter more.
Why Measure Brand Equity: Business Outcomes and Accountability
Brand equity measurement exists to answer one question leadership always asks: what is the brand actually buying us? The honest answer usually comes down to pricing power, retention, and how much cushion the brand gives you when a competitor undercuts you on price.
Marketing teams lean on brand metrics to justify budgets, defend spend during a downturn, model brand value in an M&A conversation, or isolate how much of a campaign’s lift came from brand versus promotion. Without a tracking system, every one of those conversations turns into opinion versus opinion.
Brand Statistic: Comparative research on brand equity approaches finds that product-market performance measures like revenue premium reveal true equity changes earlier than mindset surveys, and they’re easier to operationalize since they draw on data you already have.
That timing gap is exactly why ISO 20671-1 provides an integrated framework for considering brand inputs and outcomes rather than picking one. The standard gives CMOs a defensible, repeatable way to tie brand strength to shareholder value instead of relying on a single survey wave that leadership might not trust.
Three Ways to Measure Brand Equity: Mindset, Market, and Valuation
Each of the three broad approaches diagnoses something different, and none of them alone gives you the full picture.
Customer-mindset measurement tracks what’s happening inside people’s heads: aided and unaided awareness, brand associations, perceived quality, loyalty intent. It requires survey infrastructure, a representative sample, and consistent question wording wave over wave. Its strength is diagnostic depth. Its weakness is speed: attitudinal shifts often trail real market behavior by three to six months, so a survey uptick this quarter might just be catching up to something that already happened.
Product-market measurement looks at what customers actually do: price premium versus a comparable product, market share trend, repeat purchase rate. Revenue premium in particular tends to move before consumer perception surveys catch the shift, which makes it the most useful early-warning signal in a dashboard.
Financial valuation converts the above into a headline number, often using composite indices like Brand Finance’s Brand Strength Index, which blends perception and behavior data to forecast future brand performance. It’s the right tool for board reporting, licensing deals, or benchmarking against an industry average, not for weekly campaign decisions.
Practical weighting depends on your objective:
- If the objective is day-to-day brand management, emphasize awareness, associations, perceived quality, and repeat behavior; use price or revenue premium as a commercial check.
- If the objective is commercial growth, prioritize price or revenue premium, retention, and market share, then use customer research to explain the movements.
- If the objective is an M&A, licensing, or finance decision, commission a defensible brand valuation supported by financial forecasts, market behavior, and customer-based research.
- Treat these as different analytical lenses, not fixed numerical weights. Agree on the decision each measure informs before allocating a scorecard weight.
Free Brand Health Audit
Make sure your brand is built to sell
Search has changed. Your customers aren't just Googling anymore. They're asking ChatGPT, Perplexity, Gemini and other AI platforms what to buy, who to trust and which brands they should consider.
If your brand isn't showing up clearly in those answers, you're already losing opportunities. Our free Brand Health Audit shows you where your brand stands across traditional search, AI search and brand positioning.

Sample brand audit
Live preview
Traditional search
72
AI search (GEO)
34
Brand positioning
58
Core Metrics and the Signal Hierarchy That Predicts Business Impact


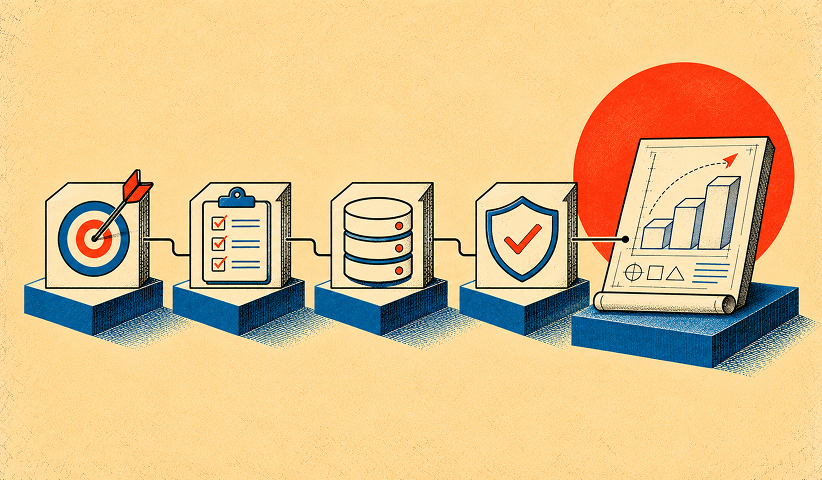

Not every metric deserves equal weight on a dashboard, and treating all of them as equally important is how brand tracking programs drown in noise.
Group your metrics into three tiers. Mindset metrics include aided and unaided awareness, top-of-mind associations, and perceived quality relative to competitors. These describe how the brand lives in memory. Outcome metrics include revenue premium, price premium, market share, repeat purchase rate, and customer lifetime value (CLV). These describe what the brand earns. Reputation and engagement metrics include Net Promoter Score (NPS), advocacy rate, and social sentiment. These describe how customers talk about you when nobody’s watching.
Brand Statistic: Practitioner analyses recommend limiting active tracking to three to five metrics that show a statistically demonstrable link to revenue, rather than tracking every attribute a survey vendor offers.
A few implementation notes worth building in from day one:
- Choose three to five decision-relevant KPIs, and write down the business question, source, owner, reporting frequency, and action threshold for each.
- Define comparators before you calculate a price premium: match product specifications, distribution, promotions, time period, and customer segment as closely as possible.
- For revenue premium, separate price differences from changes in units, distribution, product mix, and promotions; it is an outcome indicator, not by itself a causal estimate of brand impact.
- Keep survey wording, sampling method, and segment definitions constant between waves, and disclose confidence intervals when sample-based differences are discussed.
- Include at least one behavioral or revenue metric alongside attitude measures so improvement in perception is tested against observable business results.
Our brand health metrics guide breaks down how to combine attitudinal and behavioral data into a single scorecard leadership can actually read.
Qualitative and Quantitative Techniques: Which Tool for Which Question
Sequencing matters more than tool selection. Explore first, validate second, track third, and skipping the first step is the most common reason brand surveys ask the wrong questions.
- Qualitative interviews, reviews, and support transcripts: use these to uncover spontaneous associations, customer language, buying triggers, and reasons for switching.
- Quantitative brand surveys: use representative aided and unaided awareness, preference, quality, and association questions to estimate how widely those perceptions are held.
- Transaction and pricing data: use actual paid prices, repeat purchases, churn, and category share to examine whether brand perceptions correspond with commercial outcomes.
- Controlled tests or matched-market analysis: use a suitable comparison group when leadership needs stronger evidence that a brand campaign caused incremental change.
- Independent valuation: use an appropriately scoped valuation for licensing, transactions, or board-level asset assessments rather than treating a survey score as brand value.
Sequencing qualitative exploration before quantitative tracking produces measures that are both diagnostic and scalable, since the qualitative phase defines what to ask and the quantitative phase tells you how many people believe it.
Pro Tip: Before writing a single survey question, pull ten actual customer support transcripts or reviews. The phrases customers use unprompted are almost always better attribute labels than anything a positioning workshop invents.
Building a Brand Equity Measurement System That Leadership Trusts
A measurement system only earns trust if it’s repeatable, and repeatable starts with a proper baseline.
Run a brand audit before anything else: an inventory of current brand assets, messaging, and touchpoints, paired with exploratory qualitative research to understand where perception currently sits. Our brand equity preservation framework walks through this audit process in more detail, particularly useful if you’re measuring equity around a rebrand or repositioning.
From there, set a cadence: baseline the mindset metrics once, track them quarterly or biannually, and monitor outcome metrics like revenue premium and market share continuously, since the financial data already exists in your systems.
Dashboard design should map cleanly from objective to owner:
- Awareness and distinct associations: research or brand lead owns survey design, baseline, representative sample, and quarterly or biannual interpretation.
- Price or revenue premium: finance and revenue operations own the transaction definitions, comparable product set, promotions adjustments, and monthly or quarterly reporting.
- Retention and repeat purchase: CRM or customer analytics owns cohort definitions, repeat revenue, and customer lifetime value assumptions.
- Market share and distribution: commercial or category insights owns the market definition, data vendor, competitive set, and change analysis.
- Executive summary: the brand manager owns a short narrative showing what moved, what might explain it, confidence or limitations, and the next decision.
- Set decision rules in advance: a two-point drop in perceived quality triggers a qualitative deep dive; a sustained revenue-premium decline over two quarters triggers a pricing or positioning review. Without pre-agreed thresholds, every dashboard dip turns into an ad hoc debate.
Pro Tip: Annotate your dashboard with campaign launches, pricing changes, and competitor moves in real time. Six months later, nobody remembers why the line moved, and that context is the difference between a useful chart and a mystery.
Want to learn more about brand platforms, Brand Strategy and Brand Identity? Keep reading!
If you need help with your companies brand strategy and identity, contact us for a free custom quote.
Common Pitfalls in Brand Equity Measurement

The lagging-indicator trap catches the most experienced teams: because attitudinal survey shifts can trail real market behavior by three to six months, a jump in perceived quality this quarter may just be catching up to a product change from last quarter. Treat perception data as a forecast confirmation, not a live readout.
Over-surveying is the second trap. Tracking twenty attributes because a vendor bundled them in doesn’t make the dashboard more useful. Focus on the three or four levers with a proven link to revenue premium and drop the rest.
Segmentation mistakes compound quietly: blending new and loyal customers into one average score hides the fact that your brand might be winning one group and losing the other. And methodology drift, changing question wording or sample sources between waves, quietly invalidates your trend line even when nobody notices until year three.
How to Build a Brand-Health Dashboard: A Practical Checklist
- Confirm the decision: specify whether the dashboard must inform pricing, customer retention, market positioning, investment, or valuation.
- Select three to five KPIs: include at least one perception measure and one observable commercial outcome, with clear metric formulas.
- Capture baselines: retain a dated survey wave, commercial extracts, competitive price set, and notes about major campaigns and market changes.
- Assign owners and refresh schedules: name a researcher for survey data, a finance or analytics owner for revenue data, and one accountable executive.
- Document quality controls: validate segment and sample definitions, remove duplicated records, and check for price, promotion, and mix effects.
- Build a one-page view: show the baseline, latest result, period-over-period movement, relevant segment cuts, and the decision threshold.
- Pilot and review: test the dashboard with finance and marketing leaders, agree on an action for each alert, and revisit definitions after the first quarter.
In-house teams with existing analytics infrastructure can typically complete this in six to eight weeks. Teams without that infrastructure, or without survey design experience, often bring in outside support to skip the trial-and-error phase.
How The Branded Agency Builds Measurement Into Brand Strategy
We treat brand equity measurement as inseparable from performance marketing, not a separate reporting exercise bolted on afterward. When we build a brand strategy for a growth-stage client, we map the resulting brand KPIs directly to paid media performance and retention metrics from day one, so a positioning shift shows up in the same dashboard as cost-per-acquisition and repeat-purchase rate.
That integration is what lets brand-backed performance™ actually get measured instead of asserted. For readers building out their own frameworks, our brand building guide and brand positioning primer offer templates for connecting association-mapping work to the metrics covered above.
What Brand Managers Get Wrong About Measurement Trade-offs
Most brand measurement programs fail from ambition, not neglect. Teams try to track everything, present a wall of charts to leadership, and then wonder why nobody acts on any of it. The programs that actually change decisions pick a handful of metrics tied directly to revenue premium and defend that short list ruthlessly.
The second failure is pacing measurement to the survey vendor’s calendar instead of the business’s. If your pricing team makes decisions quarterly, your outcome metrics need to move at that cadence too, not whenever the tracker happens to field.
Leadership doesn’t need more dashboards. It needs three or four numbers it trusts enough to act on.
Frequently Asked Questions

What are the best KPIs for measuring brand equity?
For a practical leadership dashboard, start with three to five measures: brand awareness, distinctive associations or consideration, price or revenue premium, repeat purchase or retention, and market share where reliable category data exists. Select the final set based on the decision leadership needs to make.
How do you prove brand equity affects revenue?
Compare brand-related changes with commercial outcomes over the same period and control for pricing, promotion, distribution, seasonality, and customer mix. Where possible, use randomized holdouts or matched markets to estimate incremental impact. Correlation between a brand KPI and revenue is useful evidence but not proof of causation.
What is revenue premium in brand equity measurement?
Revenue premium examines the incremental revenue associated with a branded offering compared with a suitable reference or alternative. Define that comparison carefully, since differences in product quality, market access, and promotion can also change revenue.
How often should brand managers measure brand equity?
Monitor transaction-based outcomes monthly or quarterly when data permits. Track representative awareness and association surveys quarterly or biannually, depending on budget, purchase cycle, and the expected speed of change. Keep question wording and samples consistent.
What is the difference between brand equity and brand valuation?
Brand equity describes the advantage associated with the brand in customer perceptions and market outcomes. Monetary brand valuation estimates the financial value of the brand asset for purposes such as licensing, transactions, or finance reporting. They are related but not interchangeable.
Sources
- ISO 20671-1:2021, Brand evaluation — Part 1: Principles and fundamentals: https://www.iso.org/standard/81739.html
- Kevin Lane Keller, “Conceptualizing, Measuring, and Managing Customer-Based Brand Equity,” Journal of Marketing (1993): https://doi.org/10.1177/002224299305700101
- Brand Finance, “How We Value the Brands in Our Annual Rankings”: https://brandfinance.com/insights/methodology-brands-annual-rankings
- Brand Finance methodology should be distinguished from ISO 20671-1 brand evaluation and from ISO 10668 brand monetary valuation.

Quincy Samycia
As entrepreneurs, they’ve built and scaled their own ventures from zero to millions. They’ve been in the trenches, navigating the chaos of high-growth phases, making the hard calls, and learning firsthand what actually moves the needle. That’s what makes us different—we don’t just “consult,” we know what it takes because we’ve done it ourselves.
Want to learn more about brand platform?
If you need help with your companies brand strategy and identity, contact us for a free custom quote.
We do great work. And get great results.
+2.3xIncrease in revenue YoY
+126%Increase in repurchase rate YoY




+93%Revenue growth in first 90 days
+144% Increase in attributed revenue




+91%Increase in conversion rate
+46%Increase in AOV



+200%Increase in conversion rate
+688%Increase in attributed revenue